Estimating Building Energy Efficiency from Google Maps with Gemini
A 3-step pipeline that uses Gemini Flash Image to calculate window-to-wall ratio from street view photos — even with trees and bad perspectives.
I needed to estimate the energy efficiency of buildings from Google Maps street view photos. The key metric: window-to-wall ratio — what percentage of a building’s facade is glass versus opaque wall.
The problem? Street view photos are terrible for this. Trees block the view, cars are parked in front, the panoramic stitching creates black triangles, and the perspective makes balconies hide the windows below them.
So I built a pipeline that uses Gemini’s image generation to solve each problem in sequence.
The pipeline
Three Gemini API calls, each solving one problem:
Step 1 — Remove obstructions. Trees, cars, and street furniture are erased. The buildings behind them are filled in naturally, matching the visible facade pattern. No perspective changes, no reframing — just a clean view.
Step 2 — Isolate the target building. Everything except the building we care about gets dimmed. This focuses the next step on the right facade.
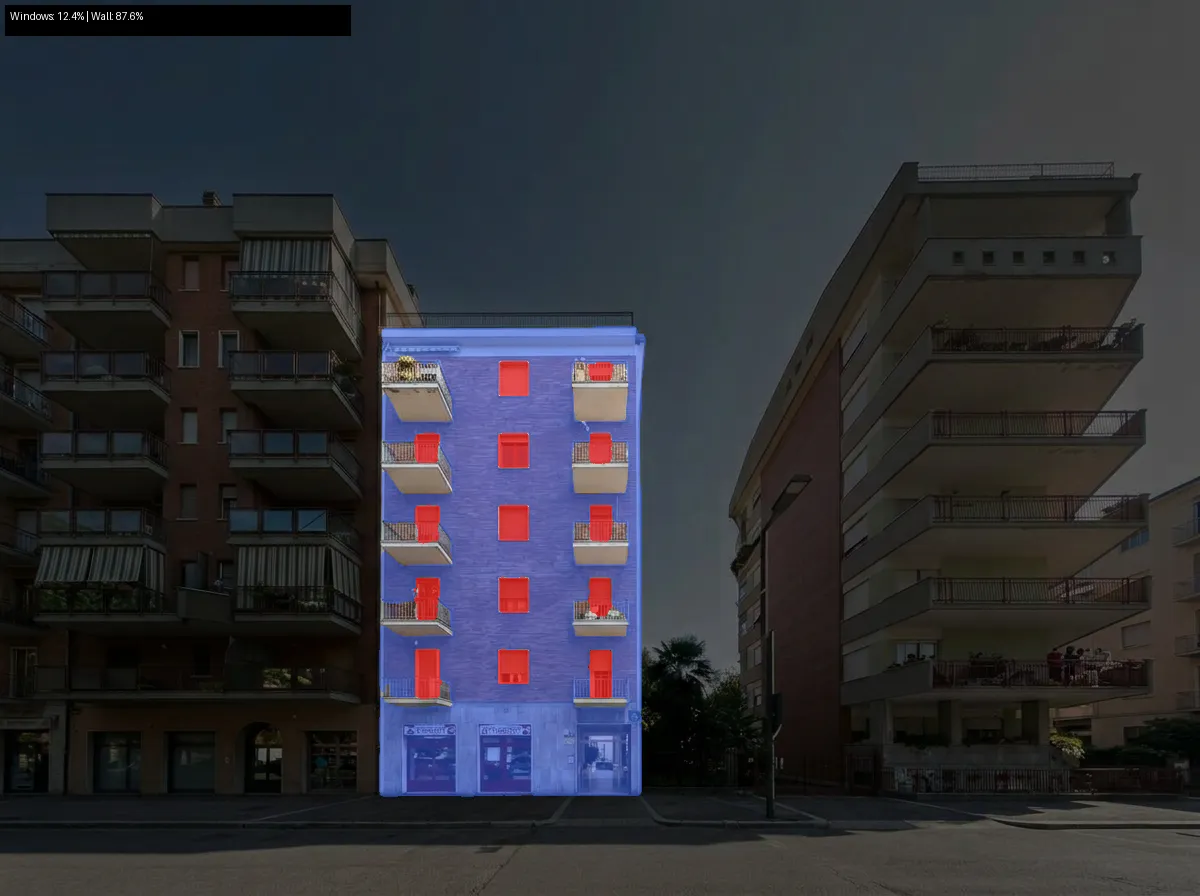
Step 3 — Generate a segmentation mask. Windows are painted red, opaque wall is painted blue, everything else is black. Then we count pixels.
The ratio of red to blue pixels gives us the window-to-wall ratio. Simple, but it works.
Example
Starting from a Google Maps street view with a massive tree blocking the center building:
Input
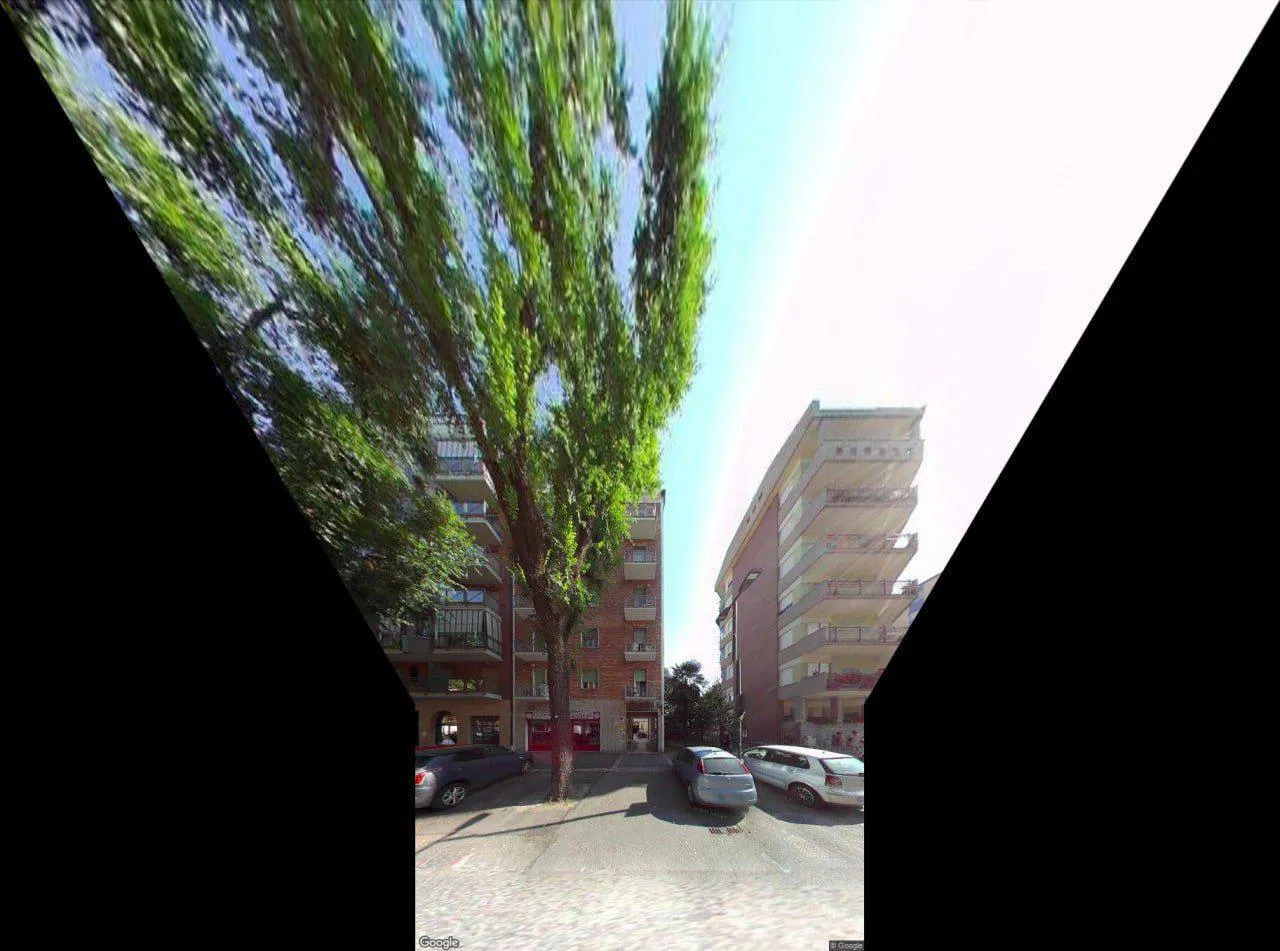
Bad panoramic stitch, huge tree covering most of the center building, cars parked in front.
Step 1 — Clean
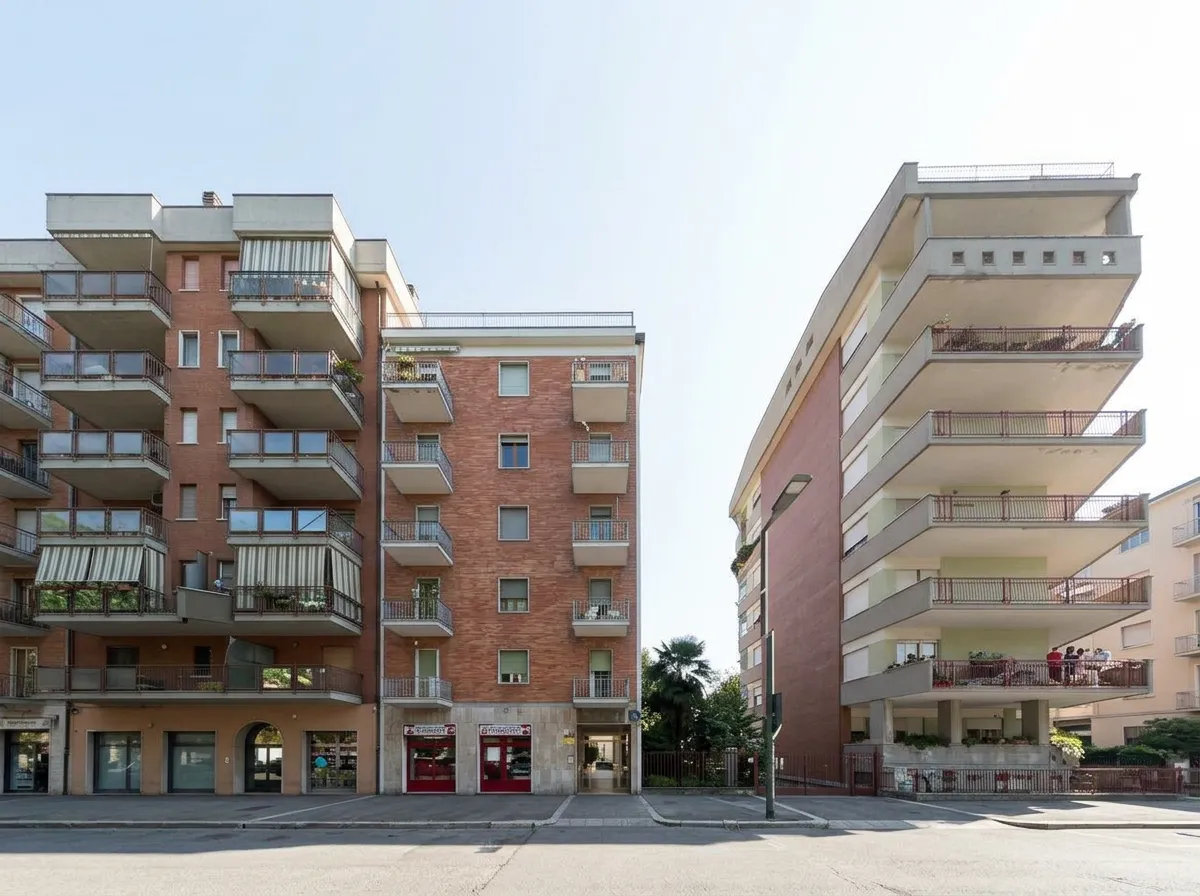
Trees and cars removed. Buildings revealed. Same perspective, slight zoom.
Step 2 — Select
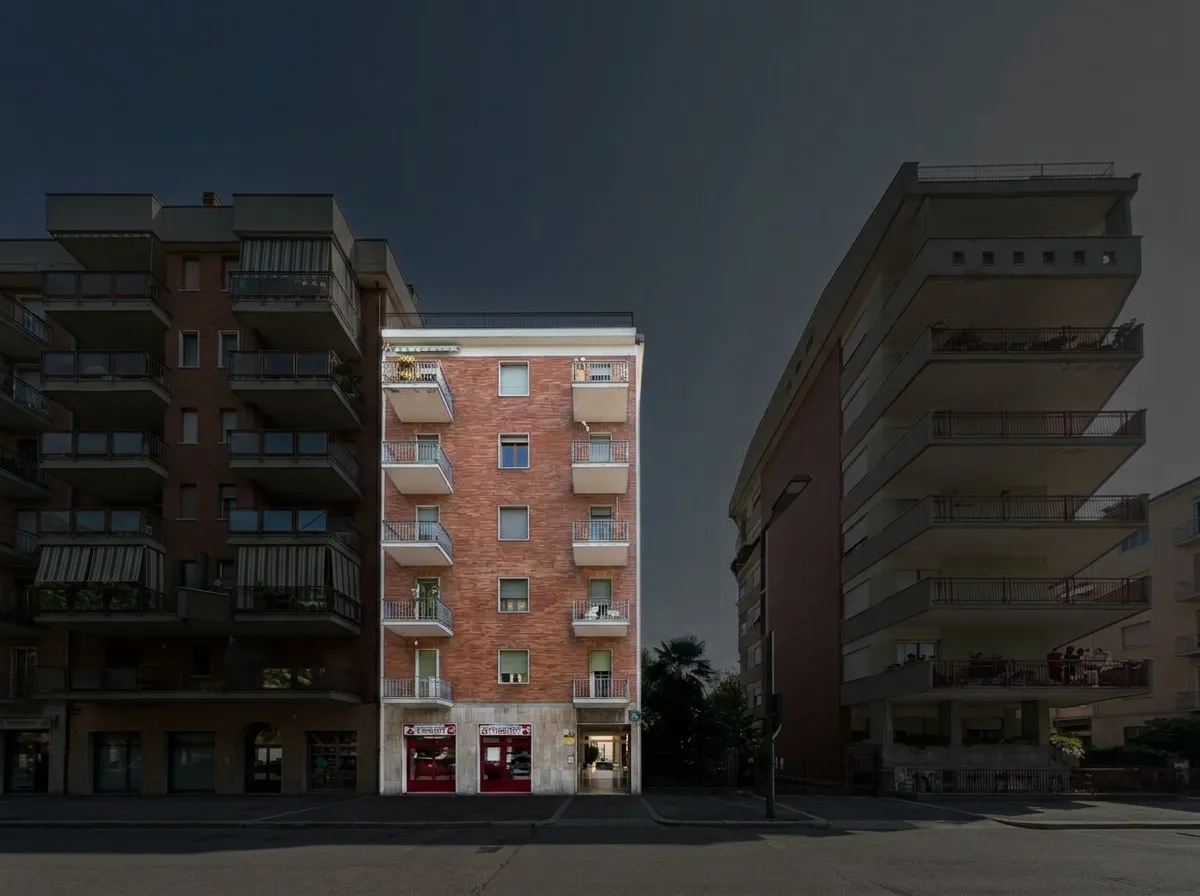
Everything dimmed except the target building. Full brightness on the building we want to analyze.
Step 3 — Mask
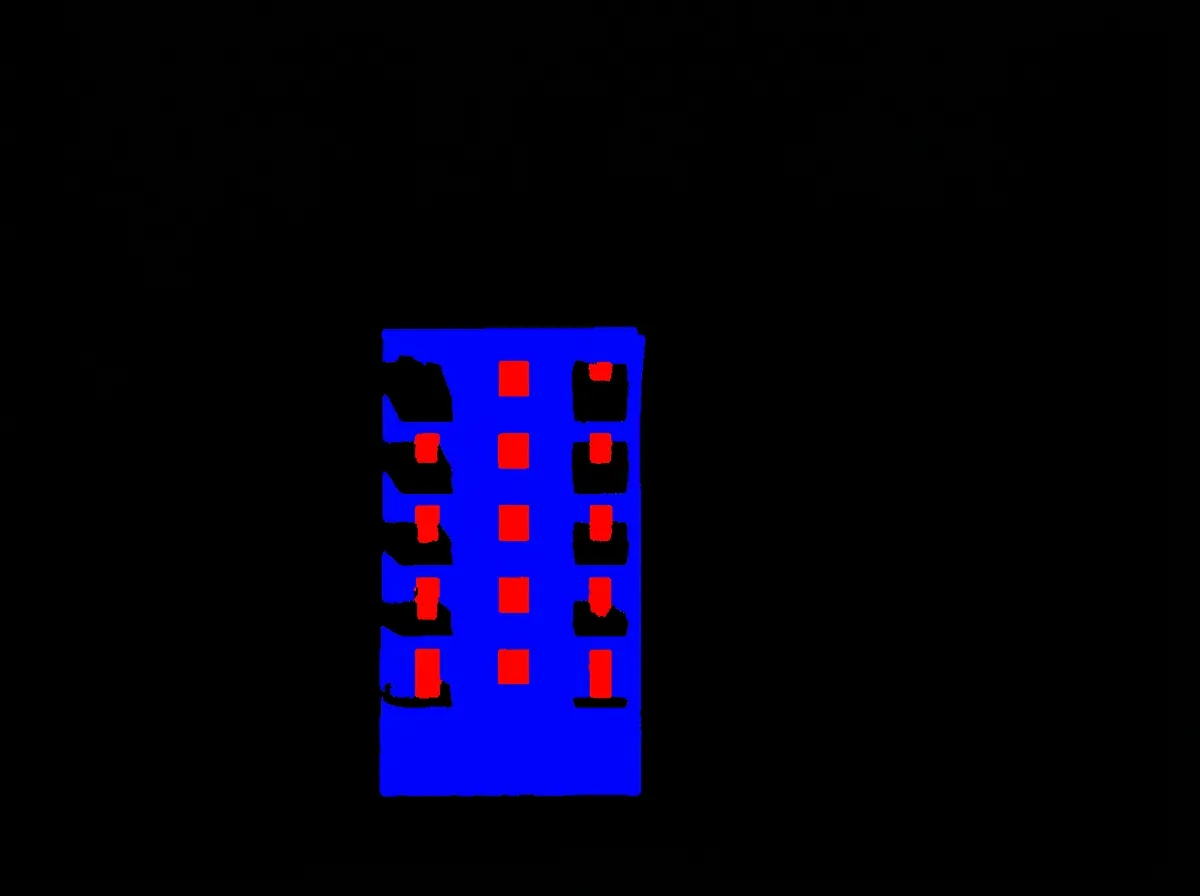
Red = windows, blue = opaque wall, black = everything else (including balconies).
Result
Windows: 12.4% | Wall: 87.6%
The prompts matter more than the code
The actual Python code is ~200 lines total. Most of the work was in prompt engineering — getting Gemini to:
-
Not invent a new building. Early prompts asking to “reconstruct the facade” produced a completely different building. The fix was telling it to keep the exact same framing and just erase obstructions.
-
Not fill the black areas. Google Maps panoramic stitching creates black triangles. Gemini kept trying to fill them with sky. The fix was not mentioning them at all and just asking for a slight zoom.
-
Target the right building. “Center building” is ambiguous. The prompt now describes it spatially: “the narrow building between the two other buildings, the one you’d walk toward.”
-
Handle balconies. From street level, balcony slabs cover the top portion of windows below. The prompt instructs Gemini to mark full window rectangles — including the part hidden behind balconies. This is still the weakest part of the pipeline.
Why this approach
The alternative is a traditional computer vision pipeline: depth estimation, semantic segmentation with SAM, perspective correction with homography transforms. This requires a GPU, multiple models, and a lot more code.
The Gemini approach trades precision for simplicity. Three API calls, ~200 lines of Python, no GPU needed. The accuracy isn’t perfect — especially around balconies — but it’s good enough for initial screening of building stocks.
For large-scale energy audits, you’d want to validate against ground truth measurements. But for quickly estimating the thermal envelope of hundreds of buildings from publicly available photos, this gets you 80% of the way with 1% of the effort.
Try it
The code is open source:
github.com/polly3223/building-window-analysis
# Install
git clone https://github.com/polly3223/building-window-analysis
cd building-window-analysis
uv sync

# Run
export GEMINI_API_KEY="your-key"
uv run run_pipeline.py your-photo.jpg
Each step is independently testable — you can swap out prompts or models for any stage without touching the rest.
Tech stack
- Gemini 3.1 Flash Image Preview — image editing + mask generation
- Python + NumPy — pixel counting
- Pillow — image I/O
- uv — package management
Three API calls per building. At Gemini Flash pricing, that’s roughly $0.01 per analysis.